| Overview:
This research was conducted in four phases:
- 1998-1999 : Development of Lithium cell design and testing varied
cathode metal-salts. Electrolyte selected.
- 2000-2001 : Testing various concentrations of electrolyte on current
output over 400s interval.
- 2001-2002 : Testing of various anions in lithium cells.
- 2002-2003 : Development of ion gradient theory, expanded data logging
and more controlled environment allows automated logging for 3600seconds
and multiple trials. Research in water concentration affecting gradient
formation and tabulations of peak and steady state current. Research
presented at Intel ISEF.
Read the paper here
, or on the web below. |
| |
| Abstract
The requirement of an anhydrous and aprotic electrolyte in lithium cells
prevents the use of aqueous electrolytes with unity transference. The
use of non-unity transference electrolytes causes concentration gradients
to form reducing the current output of the cell by increasing electrolyte
resistance.
These experiments were designed to analyze the performance of primary
lithium cells when the radii of the anion, the concentration of the electrolyte,
and the amount of water contamination in the electrolyte were varied.
This effects the rate of gradient formation and the magnitude of the gradient
at steady-state current.
It was concluded that water plays a role in increasing the rate of gradient
formation of ions with smaller radii. Furthermore, it was concluded that
a high electrolyte concentration increases the formation rate of gradients
by decreasing ion mobility due to a high viscosity.
|
| |
| Introduction Lithium
cells are becoming an increasingly important part of portable power sources
due to their high energy density and low weight. To fulfill their full
potential, lithium cells must overcome several limitations. The most significant
of these limitations is the formation of ion gradients in the cell’s
electrolyte. Such gradients impede the amount of current that the cell
can produce. Overcoming this limitation will allow lithium cells to output
an increased amount of current.
Based on earlier studies that have been conducted on lithium / silver
salt cells, it was observed that current output depended on electrolyte
concentration, viscosity, and the particular anion of the silver salt.
From reading and consultation, I have come to focus subsequent studies
on the effect of these variables on the formation of ion gradients in
these cells as an underlying factor effecting the current output.
|
| |
| Hypothesis Therefore
it is hypothesized that Li | Ag-salt cells utilizing silver salts with
anions of increasing radii will form ion gradients of different magnitudes.
These gradients will be observable as the peak in current output. It is
further hypothesized that Li | Ag-salt cells will have decreasing ion
transference rates in a LiBF4 electrolyte of increasing concentration
when the anion is not varied. This will lead to the formation of ion gradients
of increasing magnitude. The experiments described in this report were
intended to test the above stated hypotheses. Furthermore, the results
of the presented research will determine the optimum ion radii and electrolyte
concentration for lithium cells in order to optimize output current.
|
| |
| Background Concentration
Gradient formation has been a known problem in lithium cells. Concentration
gradients form when the rate of ion generation is not matched in rate
by ion transfer across the cell. Ion diffusion is driven by entropy, as
the ions try to become evenly distributed across the cell. Initially,
when current begins to flow through a cell, there are no ion gradients
present, the electrolyte resistance is at a minimum, and therefore the
cell is producing the maximum amount of current possible; this is called
initial current (I0). During current generation, an ion gradient forms
in a lithium cell since the rate of ion transport away from the anode
and cathode of the cell is less than the rate at which the ions accumulate
at the originating electrode.
Once ion gradients form, ion transport becomes limited and the resistance
of the electrolyte increases. This increase in electrolyte resistance
is due to concentration polarization of the electrolyte is defined as
a build up of anion/cation in a cell’s electrolyte. Concentration
polarization reduces the output current by introducing a counter EMF in
the electrolyte of a cell, therefore increasing the cell’s internal
resistance to the flow of current. This reduces the output current until
the rate of ion generation is equivalent to the rate of ion transport.
When this equilibrium point is reached, the current output remains constant;
this is called steady state current.
An ion’s radius has an effect on gradient formation in Li cells.
Therefore, ion radii calculated using the Kapustinskii equation [1] were
compared to current output. As anionic radii increase, the volume of an
anion increases, therefore distributing the anionic charge over a greater
volume. This decrease in the anion’s charge density has an effect
on intermolecular forces between an anion and water contamination in the
electrolyte.
The current output of a lithium cell is also dependent on the electrolyte
used. Since "lithium is more electropositive than hydrogen, the electrolyte
must be nonaqueous and aprotic" [2]. This requirement prevents the
use of aqueous electrolytes with unity transference in lithium cells.
The use of non-unity transference electrolytes causes formation of concentration
gradients, reducing the current output of the cell by increasing electrolyte
resistance. Experiments described in this report were designed to analyze
the performance of primary lithium cells when the concentration of the
electrolyte used in the cell was varied for a given silver salt. It was
postulated that this would effect the rate of gradient formation, the
magnitude of the gradient, and current output when steady-state current
is achieved.
Together, the studies described here were carried out to determine the
effects that anion size, and the corresponding anionic charge density,
and electrolyte concentrations have on gradient formation and current
output in Li cells.
|
| |
| Materials
1tank Argon
1 Dryrite tube
1 Lab. Con. Co. 50004 glove box
1sheet Bounty two-ply Paper towels
1 Wire cutter
1 razorblade
45 1ml plastic Tuberculin syringes
1 Craftsman 82325 PC interface multimeter
1 Glue gun
4 Hot melt glue sticks
35cm 3.4 mm Lithium wire (1% Sodium)
100ml C4H10O2 1,2-Dimethoxy ethane, CAS: 110-71-4, 99.5% Anhydrous
100ml C4H6O3 Propylene carbonate, CAS: 108-32-7, 99.7% Anhydrous
10g LiBF4 Lithium tetrafluoroborate, CAS: 14283-07-9, 98% Anhydrous
5g AgF Silver Fluoride, CAS: 7775-41-9
5g AgCN Silver Cyanide, CAS: 506-64-9
5g AgI Silver Iodide, CAS: 7783-96-2
5g AgBr Silver Bromide, CAS: 7785-23-1
5g AgNO3 Silver Nitrate, CAS: 7761-88-8
5g AgClO4 Silver Perchlorate, CAS: 7783-93-9
1sheet 160# sandpaper
10ml Hexane
6 20 ml scintillation vials
6 1dram vials
6 6cmX6cm-aluminum foil squares
1 25 ml volumetric flask
2 18" 16 gauge non-coring needle
4m 18 AWG bare copper wire
1 Tweezers
|
| |
Methods
Note: All experiments were done in a Lab. Con. Co. 50004 glove box under
Argon to provide an anhydrous environment. All stock chemicals were 98%
anhydrous or better. Atmosphere was dried with P2O5.
1. Preparation of chemicals
1a. Prepare a 0.0 g/ml stock solution of [electrolyte LiBF4] in 1,2-Dimethoxyethane
and Propylene carbonate; 1:1 by volume. .
1b. Prepare stock solution of 0.4 g/ml LiBF4 in 1,2-Dimethoxyethane: Propylene
carbonate, 1:1 by volume, of electrolyte
1c. Similarly, prepare the following electrolyte concentrations: 0.0 g/ml,
0.1 g/ml, 0.2 g/ml, 0.3 g/ml, and 0.4 g/ml .
1d. Grind each of the 6 silver salts listed in the “Materials”
section to a fine powder (150 mesh) and add them to separate 1dram vials
wrapped in aluminum foil.
2. Construction of cells
2a. Cut 1cm long pieces of the 3.4 mm lithium wire into a scintillation
vial filled with hexane.
2b. Remove the plungers from 1 ml Tuberculin syringes and cut the barrels
at the 0.6ml mark with a razorblade.
2c. Sand the 18 AWG un-insulated copper wire using grade 160# sandpaper.
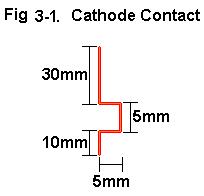
2d. Cut 55 mm pieces from the copper wire and construct cathode contacts
per Fig 3-1.
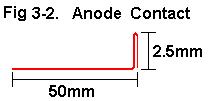
2e. Construct anode contacts per Fig 3-2.
2f. Insert the anode contact, long end first, through the syringe barrel
into the tip end of the syringe so that the straight piece of wire extends
through the end of the syringe and the loop end is in the inside of the
syringe barrel. Push the copper wire in until the loop reaches the bottom.
Connect the barrel to a vacuum source and draw hot melt glue into the
tip until it reaches the bottom of the loop.
2g. To construct separators, cut 3 cm X 2 cm rectangular pieces out of
the Bounty paper towel. Fold them into thirds along the 3 cm direction
and then roll the folded towel into a cylinder. Insert 10 separators into
a syringe barrel from which the tip was cut off. This will allow the separators
to be pushed out into the cells one at a time.
2h. Assemble lithium cells per Fig 3-3.
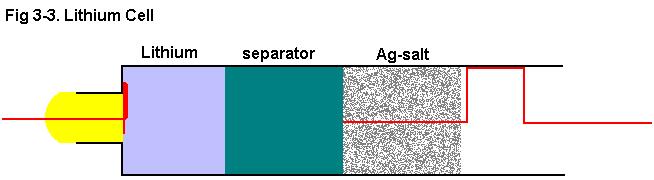
Note: Cells were tested in a vertical position with the cathode up.
Testing Li-cell properties
The lithium cells were assembled per Fig 3-3. Cells were tested in a vertical
position with the cathode up.
(1) Effect of electrolyte concentration on current output
1a. Insert a cleaned 1 cm piece of lithium into the syringe barrel and
compact the wire so it forms a tight seal at the edges of the syringe
and is in electrical contact with the copper anode contact.
1b. Add 0.3 ml of a variable concentration electrolyte, (0.0 g/ml, 0.1
g/ml, 0.2 g/ml, 0.3 g/ml, or 0.4 g/ml).
1c. Inject one separator into the lithium cell. Subject cell to light
vacuum to remove argon bubbles from separator.
1d. Start timer and add 0.2 ml of AgNO3.
1e. After 90 sec insert the cathode contact and connect multimeter.
1f. After 130 sec start data logging. Logging program will record current
output of the cell every second over a duration of 400 seconds.
1g. Repeat for electrolyte concentrations 0.0 g/ml through 0.4 g/ml
(2) Effect of electrolyte concentration on electrolyte conductivity
2a. Add 0.4 ml of variable concentration electrolyte (0.0 g/ml, 0.1 g/ml,
0.2 g/ml, 0.3 g/ml, or 0.4 g/ml) into a syringe barrel.
2b. Insert the cathode contact 1cm from anode contact and connect multimeter.
2c. Start data logging. Logging program will record resistance of the
cell every second for a duration of 400 seconds.
2d. Repeat for electrolyte concentrations 0.0 g/ml through 0.4 g/ml.
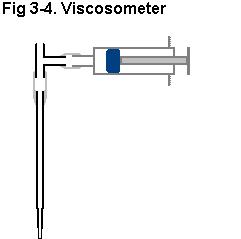
(3) Effect of electrolyte concentration on electrolyte viscosity.
3a. Measure electrolyte fall time through a 1 ml TD pipette from the 0.9
ml mark to the 0.0 ml mark (viscosometer, Fig 3-4) for electrolytes (0.0
g/ml, 0.1 g/ml, 0.2 g/ml, 0.3 g/ml, or 0.4 g/ml).
3b Calibrate viscosometer by measuring the fall time of water from the
0.9 ml mark to the 0.0 ml mark.
(4) Effect of ion radius on gradient formation and steady state
current
4a. Insert a cleaned 1 cm piece of lithium into the syringe barrel and
compact the wire so it forms a tight seal at the edges of the syringe
and is in electrical contact with the copper anode contact.
4b. Add 0.3 ml of the 0.2 g/ml electrolyte solution.
4c. Inject one separator into the lithium cell. Subject cell to light
vacuum to remove argon bubbles from separator.
4d. Start timer and add 0.2 ml of cathode salt. (AgF, AgCN, AgBr, AgNO3,
AgI, or AgClO4)
4e. After 90 sec insert the cathode contact and connect multimeter.
4f. After 130 sec start data logging. Logging program will record current
output of the cell every 4 seconds over a duration of 3600 seconds.
4g. Repeat 4 times with each cathode salt.
(5) Effect of water concentration on gradient formation.
5a. Insert a cleaned 1 cm piece of lithium into the syringe barrel and
compact the wire so it forms a tight seal at the edges of the syringe
and is in electrical contact with the copper anode contact.
5b. Add 0.3 ml of the 0.2 g/ml electrolyte solution with variable water
content (0.2%, 0.1%, or 0.01%).
5c. Inject one separator into the lithium cell. Subject cell to light
vacuum to remove argon bubbles from separator.
5d. Start timer and add 0.2 ml AgNO3
5e. After 90 sec insert the cathode contact and connect multimeter.
5f. After 130 sec start data logging. Logging program will record current
output of the cell every 5 seconds over a duration of 3600 seconds.
5g. Repeat 4 times with each electrolyte of variable water concentration.
|
| |
| Data: see archive
http://www.rtftechnologies.org/Design/Assets/files/licell/ |
| |
Results
•
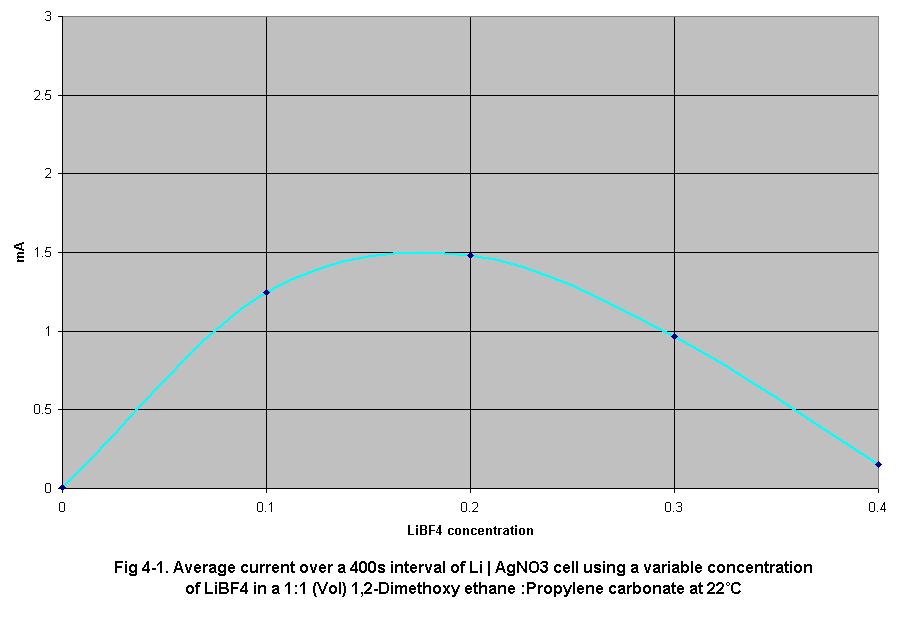
Fig 4-1 shows the average output current of a Li/AgNO3 cell as electrolyte
concentration is increased. Output current increases up to a point as
electrical resistance decreases, however it begins to decrease as the
electrolyte viscosity begins to impede ion travel resulting in concentration
polarization of the electrolyte.
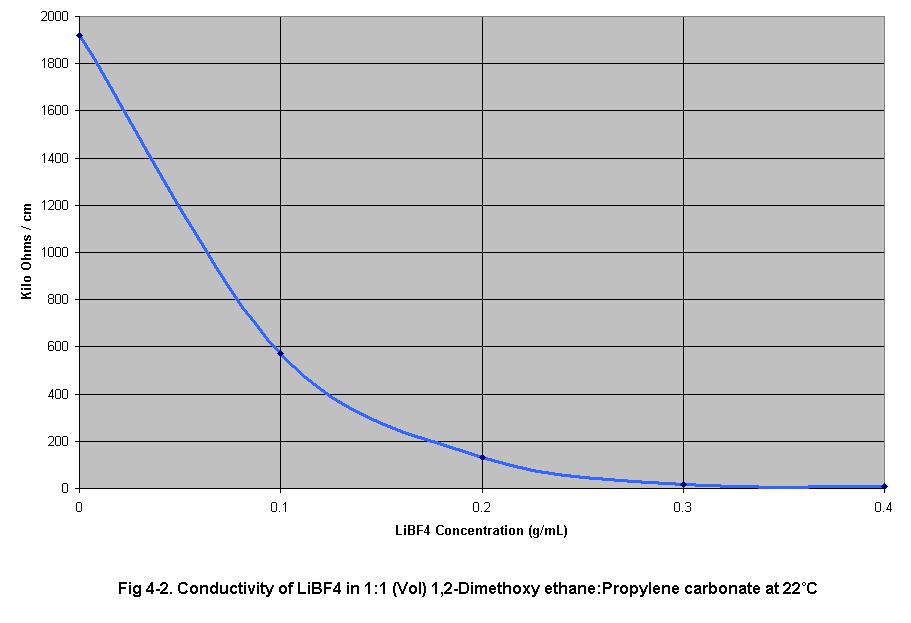
• Fig
4-2 shows an increase in electrolyte conductivity as the electrolyte
concentration increases.
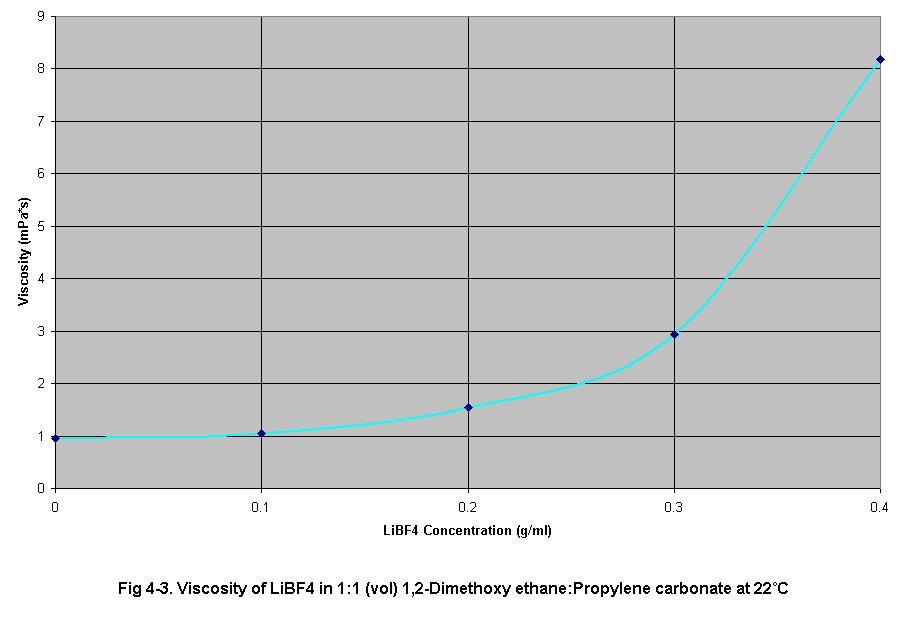
• Fig 4-3
shows an increase in electrolyte viscosity as electrolyte concentration
increases. This increase in viscosity impedes ion travel increasing the
internal resistance of the cell.
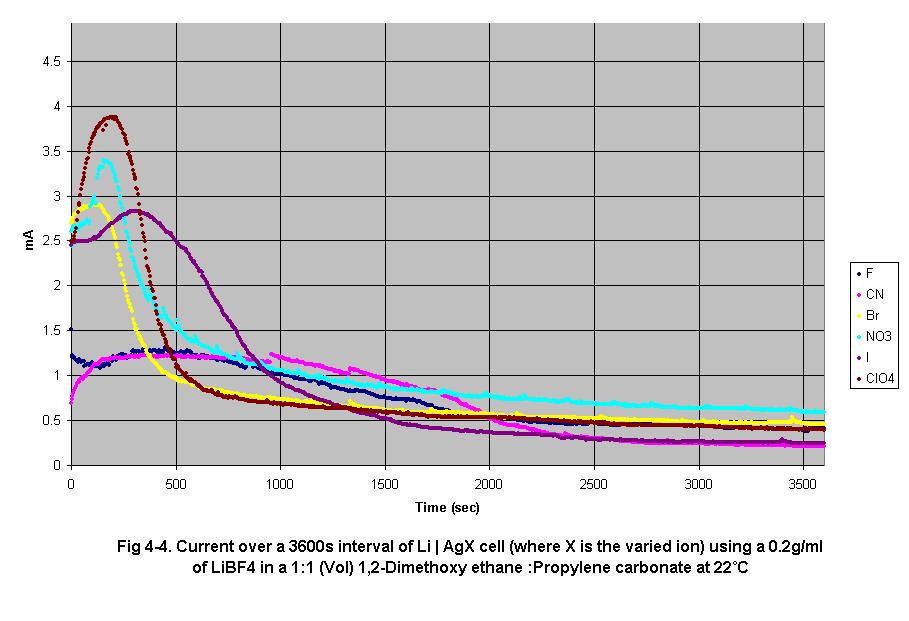
• Fig 4-4
shows an increase in peak output current as anion radius increases. This
increase in current reflects the mobility of the anion in the cell’s
electrolyte. All anions used in this experiment have a –1 charge,
only their radii change. As an anion’s radii increases, it’s
volume increases as well, decreasing its charge density. Since water has
a dipole moment, it is attracted to a given anion with a force directly
proportional to the anion’s charge density. Smaller anions have
a greater charge density and attract more water molecules increasing its
effective volume and therefore decreasing it’s diffusion rate.
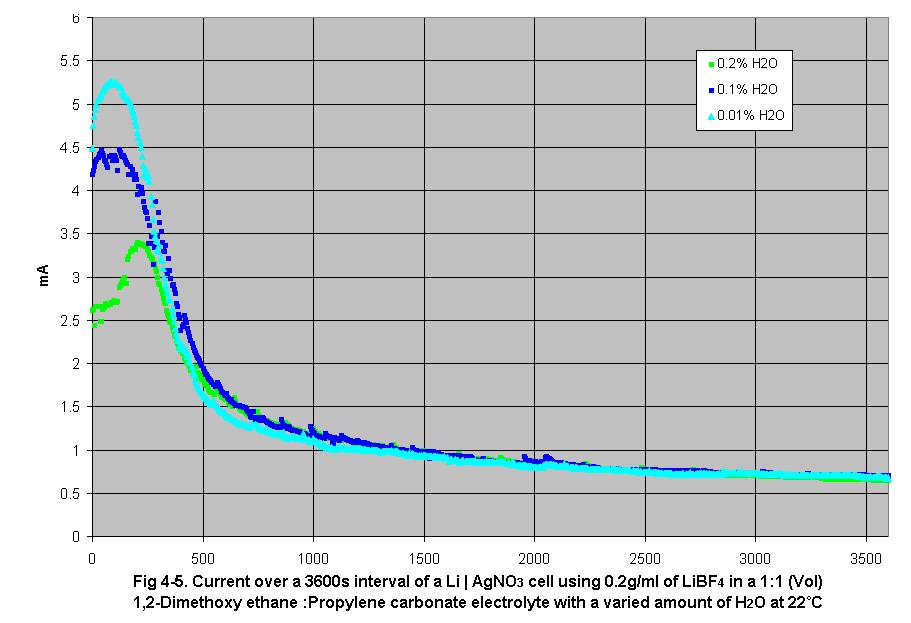
• Fig
4-5 shows that as water contamination in the electrolyte increases,
peak current output current decreases. This effect is due to the water’s
attraction to the anion, increasing the effective volume. This effective
increase in the anion’s volume reduces its diffusion rate, increasing
the magnitude of concentration polarization in the electrolyte.
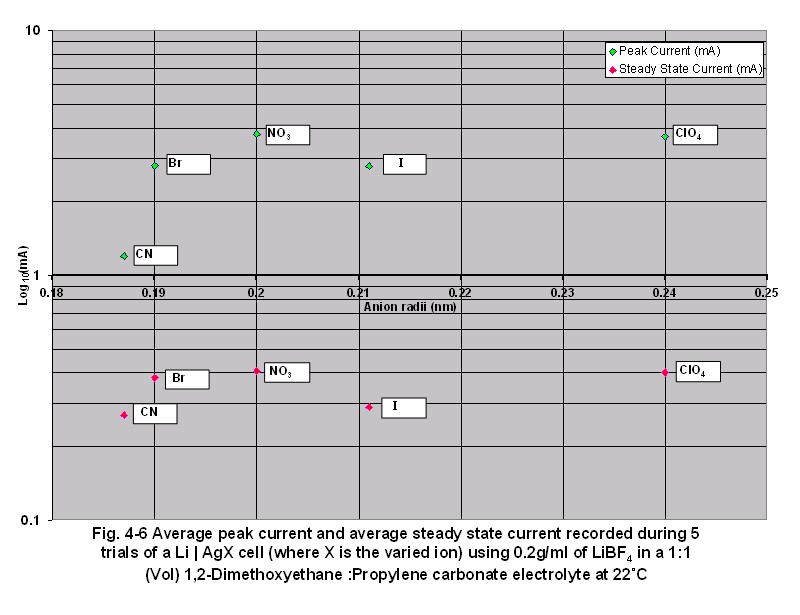
• Fig
4-6 shows the averages of the peak currents and steady state currents
recorded during 5 trials for each anion. As anion radii increased, both
the averages of peak and steady state current increased due to the lower
magnitude of ion gradients of the larger anions.
|
| |
| Discussion
In this research project five sets of experiments were conducted to analyze
ion gradient formation in Li/Ag-salt cells. These were:
1. Effect of electrolyte concentration on current output;
2. Effect of electrolyte concentration on electrolyte viscosity;
3. Effect of electrolyte concentration on electrolyte conductivity.
4. Effect of ion radius on ion gradient formation and steady state current.
5. Effect of water on ion gradient formation and steady state current
1. Effect of electrolyte concentration on current output
The results of set (1) experiments show average current output over a
400 sec duration as electrolyte concentration increased from 0.0 g/ml
to 0.4 g/ml in 0.1 g/ml increments. As electrolyte concentration increased,
current of Li-AgNO3 cells, used as standards, increased from 0.012 mA
at 0.0 g/ml to a peak of 1.585 mA at 0.2 g/ml and then decreased to 0.15
mA at 0.4 g/ml. This peak occurred at 0.2 g/ml due to optimum ion transference
rates at this concentration. The decrease in average current at electrolyte
concentrations greater then 0.2 g/ml is caused by the increased rate of
concentration gradient formation in the electrolyte caused by decreasing
transference rates due to the increase in electrolyte viscosity, (Fig
4-3). The increasing viscosity of the electrolyte decreased ion mobility
and the rate of ion diffusion of the cell causing areas of higher ion
density localized at the surfaces of the anode and cathode.
2. and 3. Effect of electrolyte concentration on electrolyte viscosity
and electrolyte conductivity
The results of set (2) and set (3) experiments show electrolyte viscosity
and electrolyte conductivity, respectively, as electrolyte concentration
increased from 0.0 g/ml to 0.4 g/ml in 0.1 g/ml increments. As electrolyte
concentration increased, conductivity and viscosity increased in an exponential
manner. In the lithium cells tested, (Fig 4-1), the effect caused by the
increase in conductivity was canceled out by the increase in viscosity
at 0.2 g/ml in regards to the average current output over a 400 sec interval.
This is due to higher viscosity electrolytes yielding lower rates of ion
diffusion. This causes an increase in the formation rate of concentration
gradients. These gradients reduce the current output of the cell.
4. Effect of ion radius on ion gradient formation and steady-state current
In this set of experiments, the rate of gradient formation increased as
ion radius increased. Since the electrolytes used were only 99.8% anhydrous,
as tested on a Karl-Fisher titratior, the relatively large amount of water
in the electrolyte impeded the motion of small ions, causing the formation
of gradients of a high magnitude near the cathode resulting in lower initial
current.
| Fig 5-1. Anion radius |
|
|
|
|
|
|
| Anion |
F |
CN |
Br |
NO3 |
I |
ClO4 |
| Anion radius (nm) |
0.126 |
0.187 |
0.19 |
0.2 |
0.211 |
0.24 |
As ion radius decreased (Fig 5-1), charge density of the ion increased
since the anionic charge was localized in a smaller volume. Since water
has a dipole moment, it is attracted to the anions with a force proportional
to the charge density. Smaller ions with higher charge density attract
more water molecules increasing the effective volume of the ion and therefore
have lower transference rates than larger ions with lower charge densities.
This effect can be seen in the results illustrated in Fig 4-4. As ion
radius increased, most cells show a higher peak current and a faster decrease
in current until current approached a steady state. At this point the
cell reached equilibrium, when the ion diffusion rate became equal to
the rate of ion production.
The peak current was caused by the increase in dissolved cathode salt
as the cell was run. The dissolved cathode salts would be in contact with
the cathode electrode, therefore increasing the effective surface area
possible to accept electrons from. This increases the current output until
ion gradients of an effective magnitude form, therefore limiting current.
The formation rate of these gradients would depend on the amount of water
in the electrolyte as well as the current flowing through the cell.
It should also be noted that as the cell runs, the electrolyte slightly
increases in concentration. Although the results in Fig 4-1 suggest that
peak current occurred at 0.2 g/ml LiBF4 in a solution 1:1 by volume of
1,2-dimethoxyethane and propylene carbonate, it should be noted that the
current was determined at electrolytes between 0.0 g/ml and 0.4 g/ml in
0.1 g/ml steps. It is known from the data in Fig 4-2 that when electrolyte
concentration increased, conductivity increased as well. Therefore it
is reasonable to assume that the conductivity of a given electrolyte will
increase as the cell is run, increasing current output, before ion gradients
cause a noticeable increase in electrolyte resistance and the cell starts
to approach steady-state current.
5. Effect of water on ion gradient formation and steady-state current
In this set of experiments, the gradient formation increased as the water
in the electrolyte increased as seen in fig 4-5. It was observed that
as water concentration increased, peak current decreased. The increase
in water concentration causes ion gradients to increase demonstrating
that water contamination in the electrolyte will reduce output current
due to the attraction between anion and water.
|
| |
|
|
| |
| Conclusion In
these experiments lithium cells were constructed to test the following
hypotheses:
• The ion migration rates in Li | Ag-salt cells will increase as
anion radii increases.
• Li | Ag-salt cells with a given anion will have decreasing ion
transference rates in a LiBF4 electrolyte of increasing concentration.
Increasing the LiBF4 concentration in the electrolyte of a Li|AgNO3 cell
increases the formation rate of gradients. This causes a resistance increase
in the electrolyte and therefore a decrease in current output. The increasing
viscosity of the electrolyte decreased ion mobility and the rate of ion
diffusion in the cell causing areas of high ion concentration localized
at the surfaces of the anode and cathode.
Ions with small radii showed a high initial rate of gradient formation.
This effect is due to the water in the electrolyte impeding the motion
of small ions, causing the formation of gradients of a high magnitude
near the cathode. The presence of these gradients resulted in a lower
initial current (Io) delaying peak output due to the slow rate at which
ion pairs were produced. Ions with larger radii show a higher current
peak due to the higher initial transference rate.
Further research of these properties in variably hydrated electrolytes
have shown that an increase in water in the electrolyte causes the current
output to decrease since the water is attracted to the anion. This increase
in the anion’s effective volume causes a decrease in ion transport
away from the cathode, increasing the rate at which ion gradients form.
The results of this research showed that water contamination decreases
the current output of cells utilizing ions with smaller radii and that
electrolyte concentration in addition to ion radii effects the magnitude
of ion gradients in the electrolyte. The optimum Li|Ag-salt cell would
have a 0.2 g LiBF4 / ml electrolyte, an anion with the maximum practical
radii and a minimum amount of water in the electrolyte.
|
| |
| Acknowledgements
This research was conducted during the months July-October 2002. Laboratory
space was provided by RTI International.
Supplies and assistance were provided by Herbert Seltzman. Professor Peter
S Fedkiw and Ruchi Singhal of the Chemical Engineering Department, NCSU,
provided background information on gradient formation in lithium cells
as well as guidance on formatting a research paper.
|
| |
| References: [1]
Bruce, Peter G., James Evans, and Colin A. Vincent. (1988). Conductivity
and Transference Number Measurements on Polymer Electrolytes. Solid State
Ionics: 918-922.
[2] Jenkins, Donald B., Jack Passmore, Leslie Glasser, and Helen K.
Roobottom et al (1999). Thermochemical Radii of Complex Ions. Journal
of Chemical Education. N.p.: The Division of Chemical Education of the
American Chemical Society, 1570-1573.
[3] Mayes, Anne M., and Donald R. Sadoway. (2002). Portable Power: Advanced
Rechargeable Lithium Batteries. MRS Bulletin: 590-592. 3 September 2002.
<http://www.mrs.org/publications/bulletin>.
[4] Linden, David. Handbook of Batteries. (1995).2nd ed. Washington,
D.C.:
McGraw-Hill, INC, 2.15-2.18.
[5] Crompton, TR. (1995). Battery Reference Book. . N.p.: Butterworth-Heinemann
Ltd,
[6] Handbook of Chemistry and Physics. (1976) . N.p.: CRC Press.
Handbook of Chemistry and Physics. (1959). N.p.: Chemical Rubber Co.
[7] Heise, George W. (1971). The Primary Battery. 1st. Ed. N.p.: John
Wiley and Sons P.
[8] "Lithium." (1993). Compton's Interactive Encyclopedia. N.p.:
Compton's NewMedia, Inc. N.
[9] Fedkiw, Peter S., (April - November 2002). Personal communications.
Department of Chemical Engineering, NCSU, Raleigh, NC.
|